If you’re reading this, then chances are you are already familiar with project management tools and – if luck has it – you are using monday.com.
But, the type of chart you use may be different from others. And one that often stands out as the front runner in project management is the Gantt chart.
Henry Gantt created the Gantt chart to help see worker’s progress toward task completion—allowing him and his supervisors to observe if production schedules were behind, ahead, or on track — with ease.
As you can imagine, the Gantt chart took off! It became a revolutionary tool in project management and the rest was history!
When Henry Gantt started, Gantt charts were a thing of pen and paper, but now you can do it all with just a few clicks!
How do project managers leverage Gantt charts in project management?
Gantt charts serve three key purposes:
- Building and Managing Projects: Gantt charts break down projects into manageable tasks, displaying dependencies, assignees, and milestones on a unified timeline.
- Determining Logistics and Task Dependencies: Assess project schedules and logistical aspects with Gantt charts. Task dependencies ensure seamless transitions between tasks, crucial in multi-team environments.
- Monitoring Project Progress: Track project health by logging team time against tasks. Gantt charts feature release dates, milestones, and metrics, facilitating progress tracking across teams.
Benefits of Gantt Charts
Teams adopt Gantt charts for streamlined project planning amidst changing deadlines and diverse teams. They offer a comprehensive view of project timelines, milestones, and dependencies, aiding in strategic decision-making. Programs like Jira Software with Roadmaps enhance visualization, illustrating the impact of choices on deadlines.
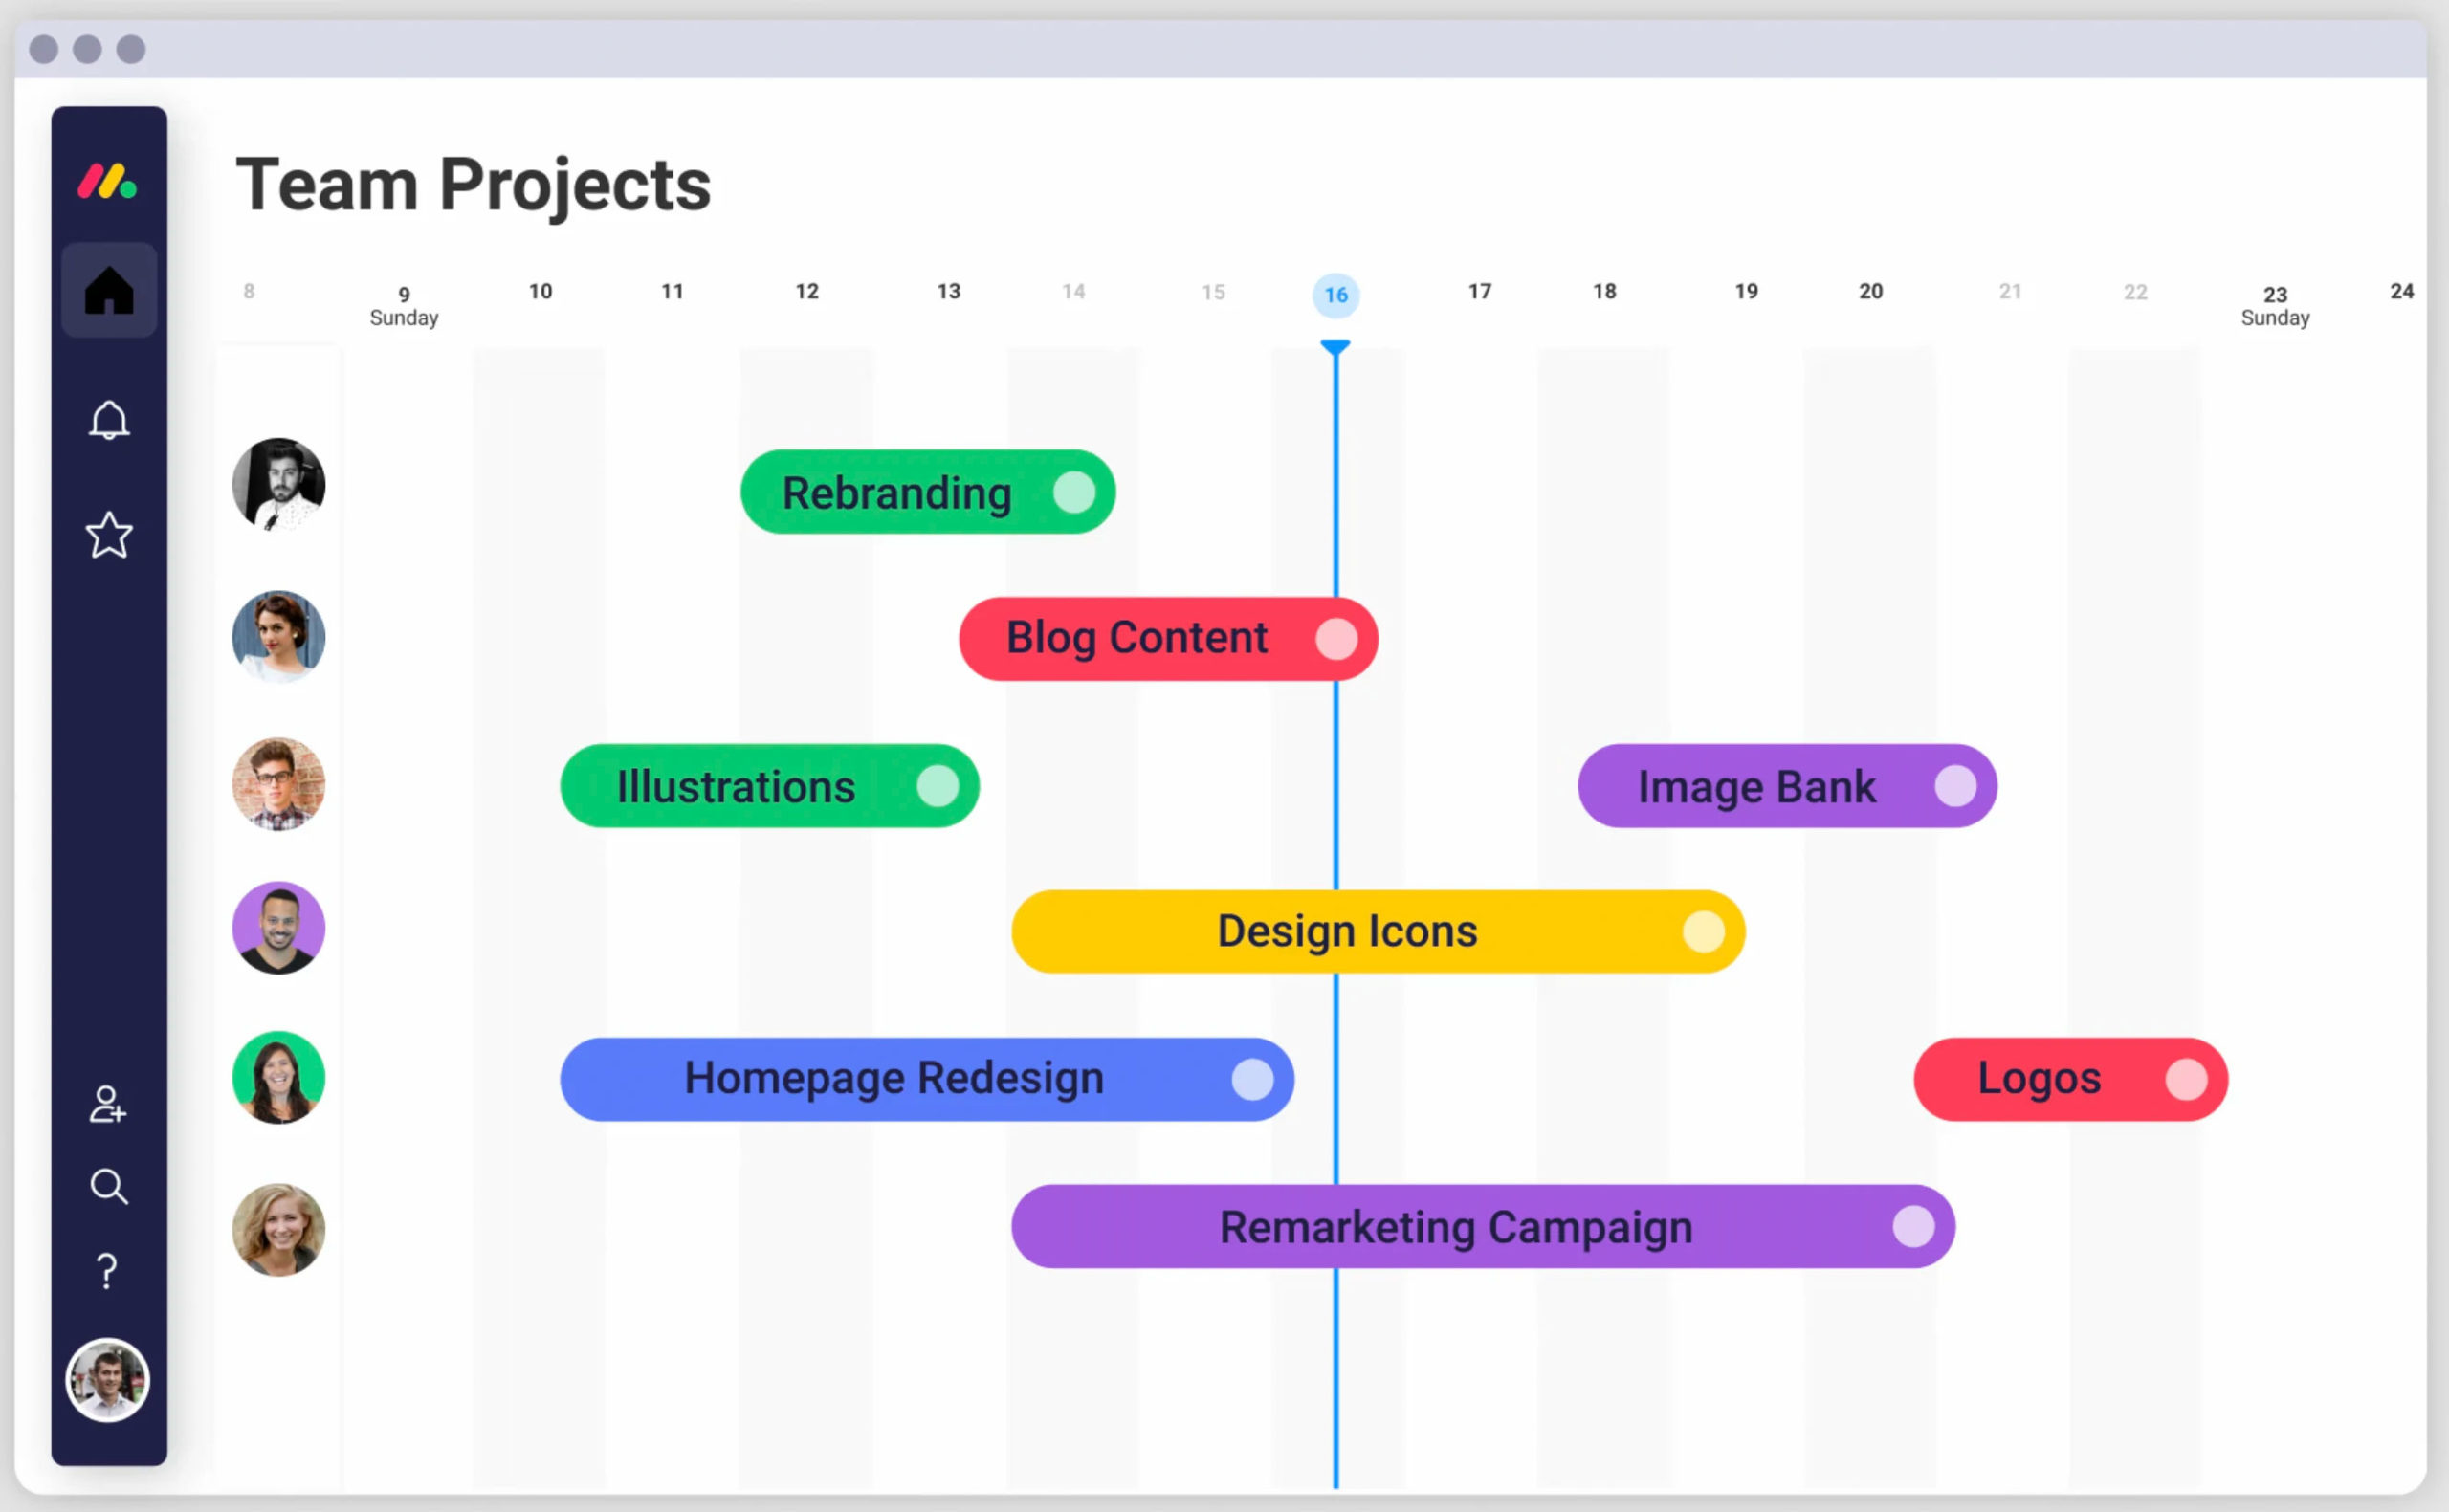
How to use Gantt Charts in monday.com
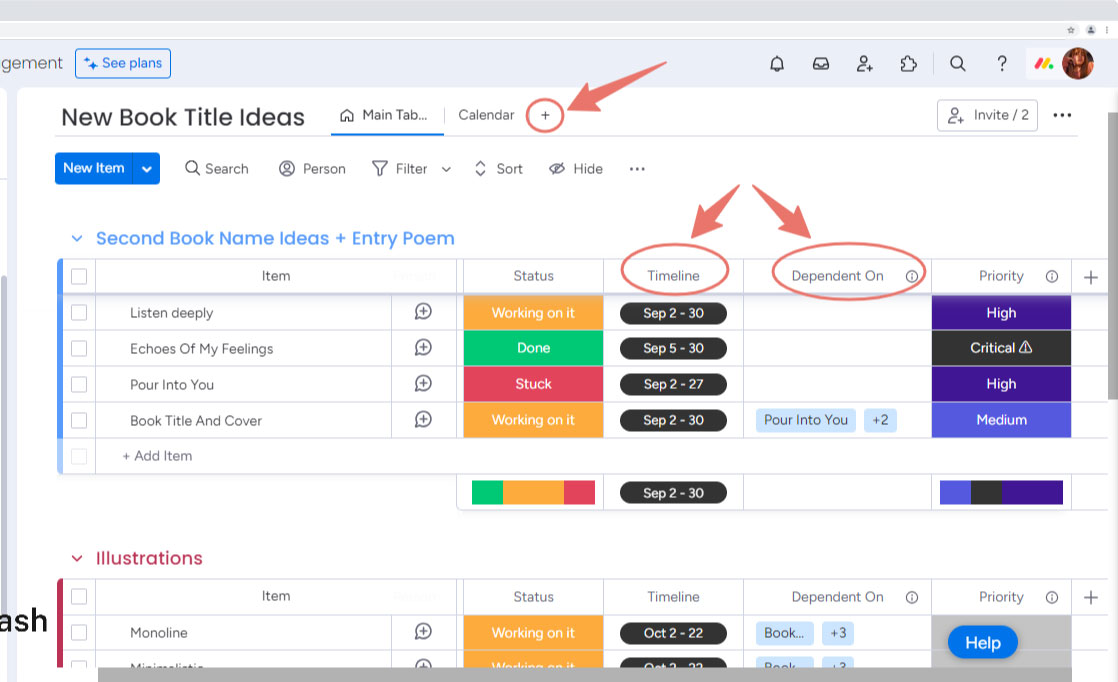
- Open the board you would like to view as a “Gantt Chart”. Add the“Timeline” and “Dependency” columns for a more accurate visual for your project.
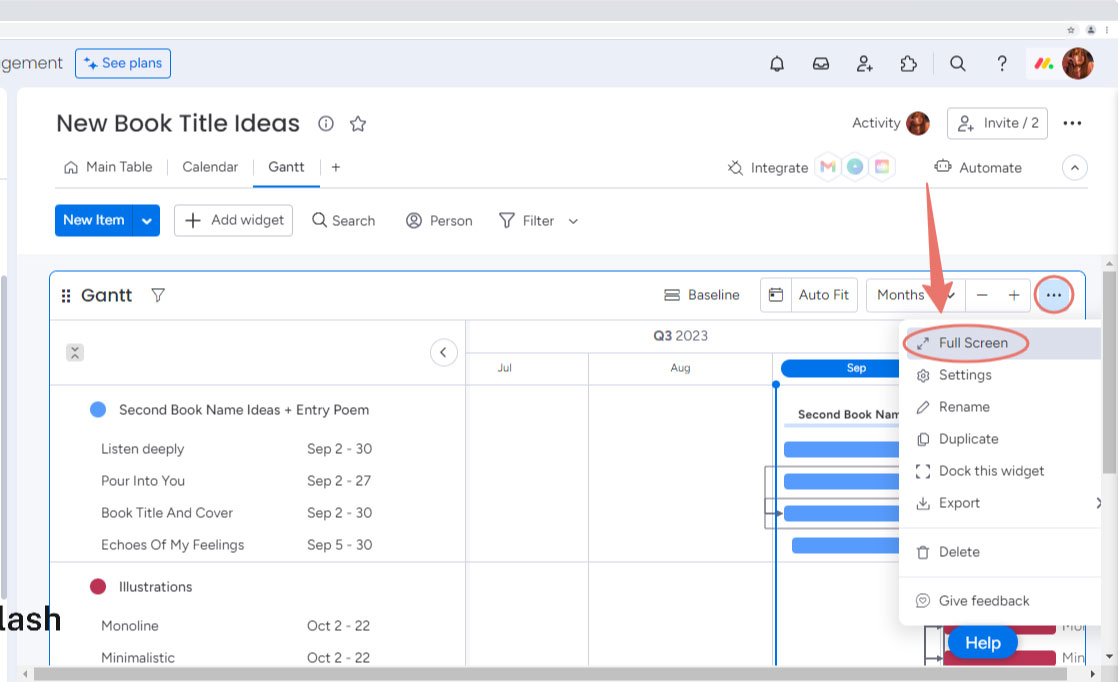
2. Click on (+) to add a view and click on “Gantt”.
3. Open your “Gantt” view to full screen to adjust your “Settings”.
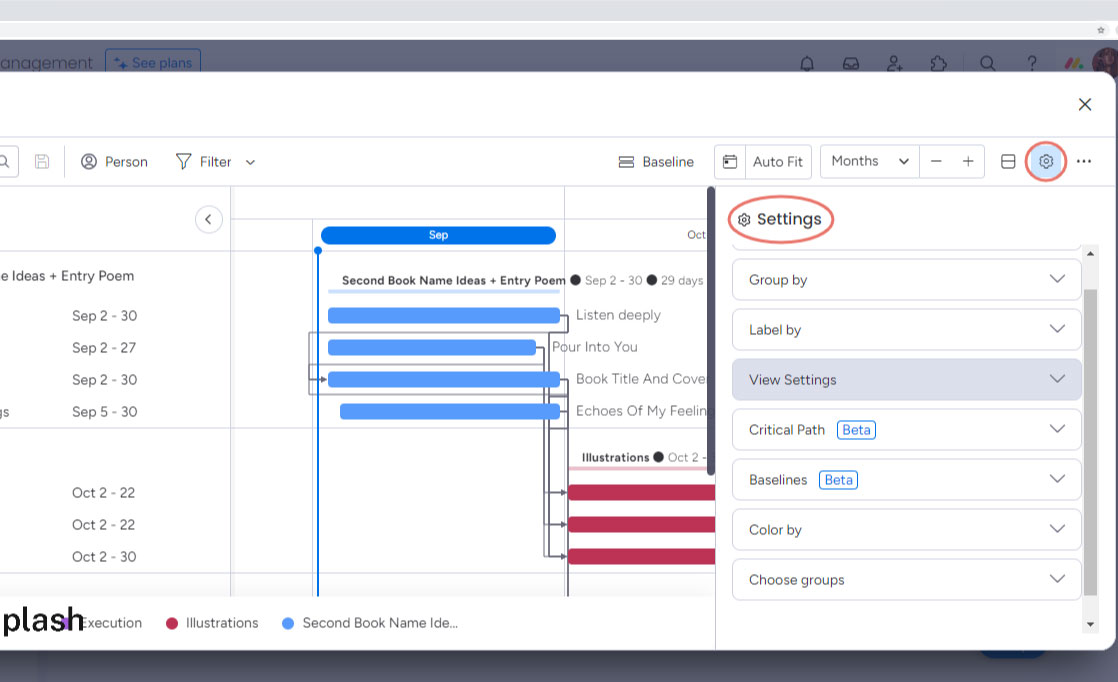
4. “Settings” allows you to adjust the way you view your scheduled tasks.
5. You are able to view it in Days, Weeks, Months, Quarters, or Years.
It’s that easy!
If you need any help setting up your Gantt charts with more detail, just give us a shout through the Contact page and we will be happy to help transform your CRM to fit your needs!